Illustration Image

Cassandra.Link

The best knowledge base on Apache Cassandra®

Helping platform leaders, architects, engineers, and operators build scalable real time data platforms.

3/14/2018

Reading time:7 min

Report Number Three (Cassandra, Spark and Solr)

by John Doe

Changing from Hadoop to Spark, refining mandatory calculation, adding field statistics, storing records in Cassandra, indexing with Solr and calculating uniqueness.Changing to SparkLast year I did some Coursera courses on Big Data and Data Science (I recommend you Bill Howe’s course from the University of Washington if you like to understand theoretical background behind relational databases anddata science, and I don’t recommend these coursesprovided by the University of California San Diego) where I have learntabout Apache Spark. Spark’s big promise is that it is quicker than Hadoop’s MapReduce and more memory effective. For me itwas even more important, that I really don’t use the “reduce” part of MapReduce, and Spark is fine with that.The change was not hard at all, since the business logic is separated in different classes to which Hadoop was just a client (the only existing client actually, but I planned to add other interfaces). For the same functionality Sparkran 4 times faster than Hadoop (1.5 hours versus 6 hours). It was a real gain, it means that I can change the codes andrun it again several times a day if I want to implement something new.Refining mandatory calculationThanks to the feedbacks from the Europeana Data Quality Comittee we improved the mandatory dimension of the completeness measure. This tell us how a record fit to the basic Europeanaa Data Model (EDM) schema requirements. PreviouslyI calculated each field individually, but that was bad: some fields are alternative to each other, so a record is valid ifeither dc:title, dcterms:alternative or dc:description is present. Now the mandatory score gives what is expected, and it is a real discriminator of bad records.Now the program assigns 1 if a field is existing and 0 if not for 30+ fields. The R script creates record sets summaryof it, and on the interface I introduces the d3.js data visualization library to display those values. I also introduces some filters in the UI: the user can hide those collections which doesn’t have a particular field, those in whichevery records have it, and those in which some records have it. The user can investigate each fields.The usage of the fields accross all the records:The usage of dcterms:alternative in those data providers, which uses it in some of the records, but not in all:An exampleabout the dcterms:alternative across data providers.Storing records in Apache CassandraSo far it was a problem, that in the record view of the UI I was nat able to extract an individual record from the huge JSON files I stored the data. After sime investigation I choosed Apache Cassandra, which has an interface for both Java and PHP. I imported every records to it, but now I still use thhe JSON files stored in HDFS (Hadoop Distributed File System) in the Spark analysis. It is on my TODO list to compare the performance if using files and interating over every Cassandra records – my hipothesis is that file based iteration is quicker. Now only the ID and the JSON content isstored in Cassandra, I am thinking about to store the measurements as well: it would be good if I would like to search for each record having a score between say 0.2 and 0.4.Uniqueness calculationI have started investigating the uniqueness or entropy of some selected fields (dc:title, dcterms:alternative and dc:description). The basic idea is that if the terms in these fields are frequent accross the records, then it is less unique, so less important. If a term is frequent in the same field it is more important than terms appear only once. This is called information entropy or in the search engive world TF-IDF formula (term frequency, inverse document frequency) – see tf-idf Wikipedia article.The Apache Solr search engine’s relevancy ranking mostly based on this formula (however there are lots of tuning possibilities, such as give fields weights etc.), but Solr doesn’t provide an interface by default for extracting the terms TF-IDF score. There is a Term Vector Component however which provides this interface given that you apply some additional indexing rules. It is not available in the ordinary Europeana Solr setup so I have created a new Solr instance with this special settings, and created a brand new index with limited fieldset. (If you want to check how to setup Solr and what interface you can use, check this wiki page.When the index were created (it took five days, but it is improvable) the scores of a field (in this case the dc:title “Fleming/Mair wedding, Slaithwaite, Huddersfield” – from this record) can be read from Solr API in the following form:"dc_title_txt":{ "fleming":{ "tf":1, "df":1073, "tf-idf":9.319664492078285E-4 }, "huddersfield":{ "tf":1, "df":12073, "tf-idf":8.282945415389712E-5 }, "mair":{ "tf":1, "df":178, "tf-idf":0.0056179775280898875 }, "slaithwaite":{ "tf":1, "df":477, "tf-idf":0.0020964360587002098 }, "wedding":{ "tf":1, "df":10226, "tf-idf":9.778994719342852E-5 }}Note: I did not applied truncation and other fancy Solr analyzes on the fields, it is only the lower case transformationapplied. The API returns the stored terms in alphabetical order. I removed some properties Solr reports but irrelevant from our current perspective.I have extracted these info for the above mentiond three fields, and created two scores: a cumulative score which summarizes the all terms in the field, and an average, which is the average of the terms’ tf-idf score. Those records which don’t have the field get 0 for both.The graphs visualize the average uniqueness of terms in the field. You can see that - as expected - there are lots of records where this value is quite low - it means that the words of the title are usually common words. There are however some titles which have unique words. If the value is higher than 1, it means that a unique word appears multiple times in this field (unique means that it appears in only one record). In this particularly record set there is no such an example, but there are others, such as “Doog, Doog, Doog, Doog” (an indian one) or “Csalo! Csalo!” (a Hungarian one). In this particular dataset the most unique title is “Iganteçtaco pronoua, eta hilen pronoua.” in which “eta” is a common term, “hilen” and “Iganteçtaco” is unique, and “pronoua” is repeated unique.In order to make comparision of the scores and the record, a two new features were added to the record view.The first one is the term frequency viewer. Here you can see the terms stored, the term frequency (how many times the term appears in the current field instance), the document frequency (how many document has this term in this field) and the tf-idf scores Solr calculated.The second one is a “naked” record view: it displays the non technical fields of the ore:Aggregation and ore:Proxy of the record. Those fields which are not analyzed in the current session (such as tableOfContents) are displayed in grey.You can access thhe UI in the usual web interface:http://144.76.218.178/europeana-qa/Select one of the last six dimension to get the results.Events, presentation, articleThe big news is that the Europeana Data Quality Committee as a Europeana Network and EuropeanaTech Working Group is formed in March. It is a great honor, that I was involved. We have a quite active message board, a bi-weekly teleconference and a bi-yearly face-to-face meeting.I wrote an article for GWDG Nachrichten about the metadata quality issues in Europeana covering the roles of the Data Quality Committee, and Mr Yahyapour, the director of GWDG wrote a recommendation in the editorial column. The GWDG Nachrichten is circulated in the Göttingen Campus and in Max Planck Institutes.I presented the research in Networkshop 2016 conference at the end of March in my home town. It was exceptional for me that I talked at the Auditorium Maximum of the University of Debrecen where I saw soo many unforgottable concerts, movies and speachhes as a teenager. Unfortunatelly I was the very last speaker on that day, and there were no time left for discussions. Here you can see the slides (note: they are in Hungarian).

Illustration Image

Changing from Hadoop to Spark, refining mandatory calculation, adding field statistics, storing records in Cassandra, indexing with Solr and calculating uniqueness.

Changing to Spark

Last year I did some Coursera courses on Big Data and Data Science (I recommend you Bill Howe’s course from the University of Washington if you like to understand theoretical background behind relational databases and data science, and I don’t recommend these courses provided by the University of California San Diego) where I have learnt about Apache Spark. Spark’s big promise is that it is quicker than Hadoop’s MapReduce and more memory effective. For me it was even more important, that I really don’t use the “reduce” part of MapReduce, and Spark is fine with that. The change was not hard at all, since the business logic is separated in different classes to which Hadoop was just a client (the only existing client actually, but I planned to add other interfaces). For the same functionality Spark ran 4 times faster than Hadoop (1.5 hours versus 6 hours). It was a real gain, it means that I can change the codes and run it again several times a day if I want to implement something new.

Refining mandatory calculation

Thanks to the feedbacks from the Europeana Data Quality Comittee we improved the mandatory dimension of the completeness measure. This tell us how a record fit to the basic Europeanaa Data Model (EDM) schema requirements. Previously I calculated each field individually, but that was bad: some fields are alternative to each other, so a record is valid if either dc:title, dcterms:alternative or dc:description is present. Now the mandatory score gives what is expected, and it is a real discriminator of bad records.

Now the program assigns 1 if a field is existing and 0 if not for 30+ fields. The R script creates record sets summary of it, and on the interface I introduces the d3.js data visualization library to display those values. I also introduces some filters in the UI: the user can hide those collections which doesn’t have a particular field, those in which every records have it, and those in which some records have it. The user can investigate each fields.

The usage of the fields accross all the records:
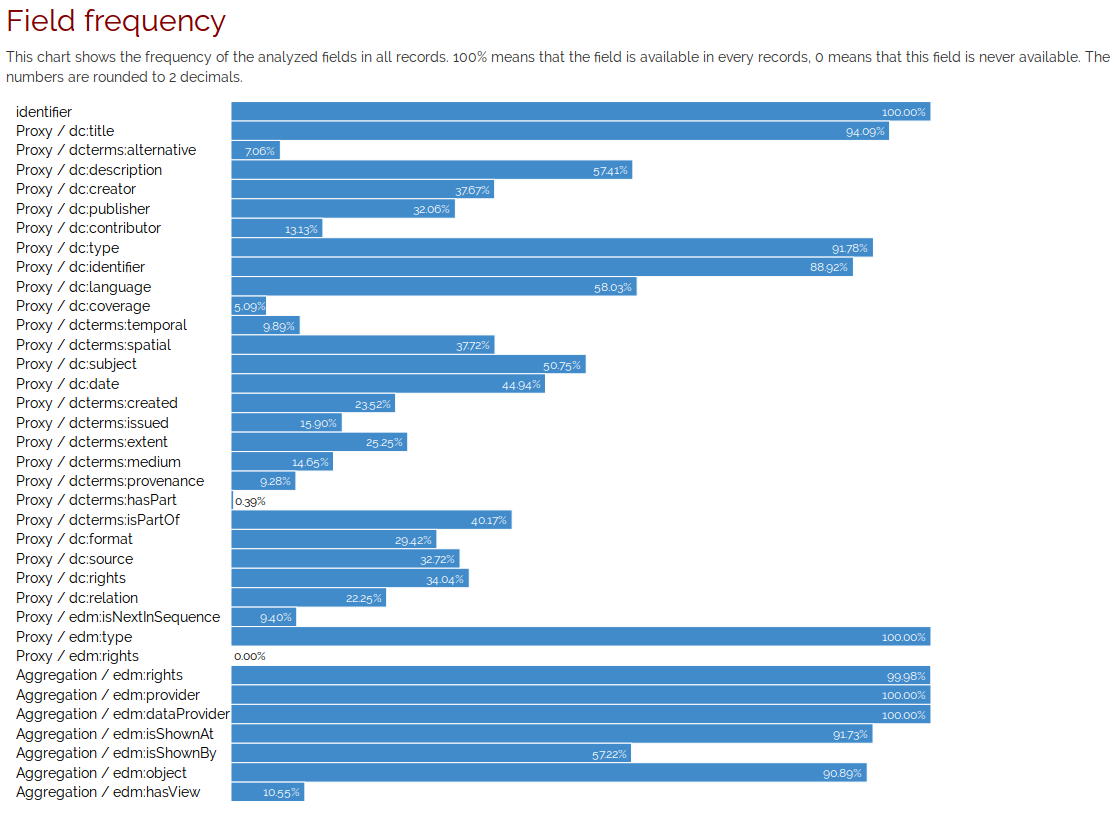
Field frequency

The usage of dcterms:alternative in those data providers, which uses it in some of the records, but not in all:
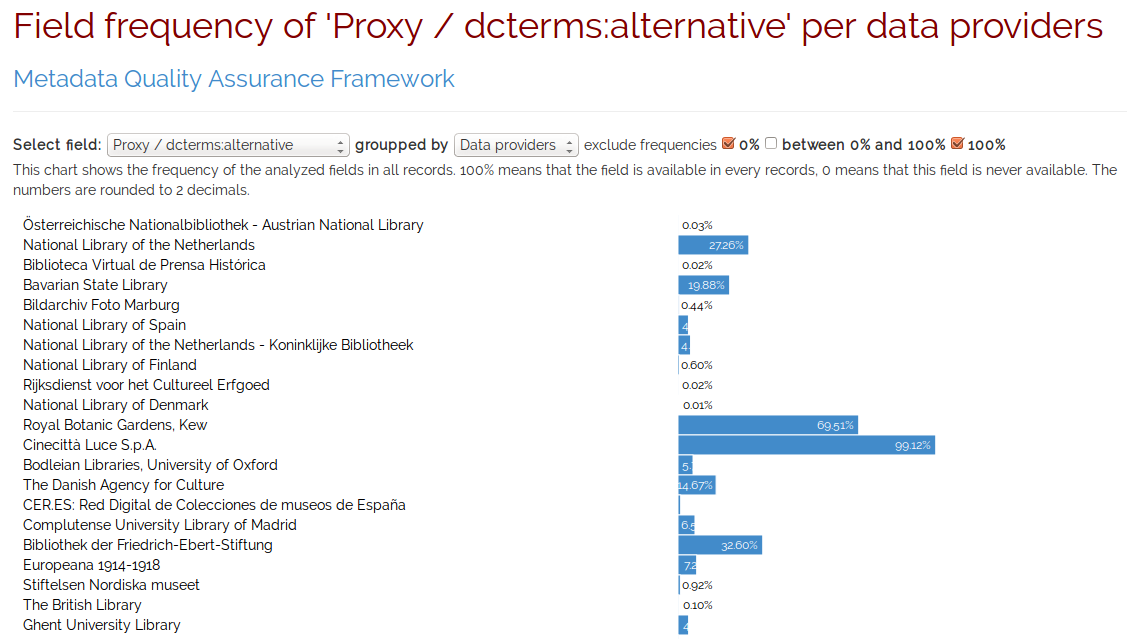
dcterms:alternative frequency

An example about the dcterms:alternative across data providers.

Storing records in Apache Cassandra

So far it was a problem, that in the record view of the UI I was nat able to extract an individual record from the huge JSON files I stored the data. After sime investigation I choosed Apache Cassandra, which has an interface for both Java and PHP. I imported every records to it, but now I still use thhe JSON files stored in HDFS (Hadoop Distributed File System) in the Spark analysis. It is on my TODO list to compare the performance if using files and interating over every Cassandra records – my hipothesis is that file based iteration is quicker. Now only the ID and the JSON content is stored in Cassandra, I am thinking about to store the measurements as well: it would be good if I would like to search for each record having a score between say 0.2 and 0.4.

Uniqueness calculation

I have started investigating the uniqueness or entropy of some selected fields (dc:title, dcterms:alternative and dc:description). The basic idea is that if the terms in these fields are frequent accross the records, then it is less unique, so less important. If a term is frequent in the same field it is more important than terms appear only once. This is called information entropy or in the search engive world TF-IDF formula (term frequency, inverse document frequency) – see tf-idf Wikipedia article.

The Apache Solr search engine’s relevancy ranking mostly based on this formula (however there are lots of tuning possibilities, such as give fields weights etc.), but Solr doesn’t provide an interface by default for extracting the terms TF-IDF score. There is a Term Vector Component however which provides this interface given that you apply some additional indexing rules. It is not available in the ordinary Europeana Solr setup so I have created a new Solr instance with this special settings, and created a brand new index with limited fieldset. (If you want to check how to setup Solr and what interface you can use, check this wiki page.

When the index were created (it took five days, but it is improvable) the scores of a field (in this case the dc:title “Fleming/Mair wedding, Slaithwaite, Huddersfield” – from this record) can be read from Solr API in the following form:

"dc_title_txt":{
  "fleming":{
    "tf":1,
    "df":1073,
    "tf-idf":9.319664492078285E-4
  },
  "huddersfield":{
    "tf":1,
    "df":12073,
    "tf-idf":8.282945415389712E-5
  },
  "mair":{
    "tf":1,
    "df":178,
    "tf-idf":0.0056179775280898875
  },
  "slaithwaite":{
    "tf":1,
    "df":477,
    "tf-idf":0.0020964360587002098
  },
  "wedding":{
    "tf":1,
    "df":10226,
    "tf-idf":9.778994719342852E-5
  }
}

Note: I did not applied truncation and other fancy Solr analyzes on the fields, it is only the lower case transformation applied. The API returns the stored terms in alphabetical order. I removed some properties Solr reports but irrelevant from our current perspective.

I have extracted these info for the above mentiond three fields, and created two scores: a cumulative score which summarizes the all terms in the field, and an average, which is the average of the terms’ tf-idf score. Those records which don’t have the field get 0 for both.
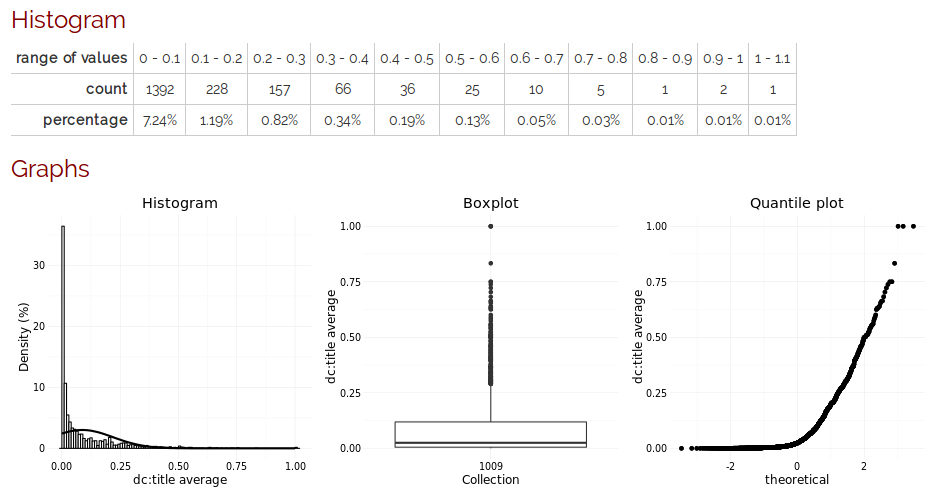
Uniquenes

The graphs visualize the average uniqueness of terms in the field. You can see that - as expected - there are lots of records where this value is quite low - it means that the words of the title are usually common words. There are however some titles which have unique words. If the value is higher than 1, it means that a unique word appears multiple times in this field (unique means that it appears in only one record). In this particularly record set there is no such an example, but there are others, such as “Doog, Doog, Doog, Doog” (an indian one) or “Csalo! Csalo!” (a Hungarian one). In this particular dataset the most unique title is “Iganteçtaco pronoua, eta hilen pronoua.” in which “eta” is a common term, “hilen” and “Iganteçtaco” is unique, and “pronoua” is repeated unique.

In order to make comparision of the scores and the record, a two new features were added to the record view.

The first one is the term frequency viewer. Here you can see the terms stored, the term frequency (how many times the term appears in the current field instance), the document frequency (how many document has this term in this field) and the tf-idf scores Solr calculated.
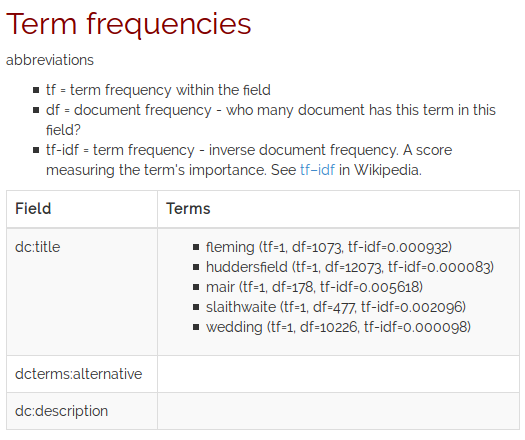
Term frequencies

The second one is a “naked” record view: it displays the non technical fields of the ore:Aggregation and ore:Proxy of the record. Those fields which are not analyzed in the current session (such as tableOfContents) are displayed in grey.
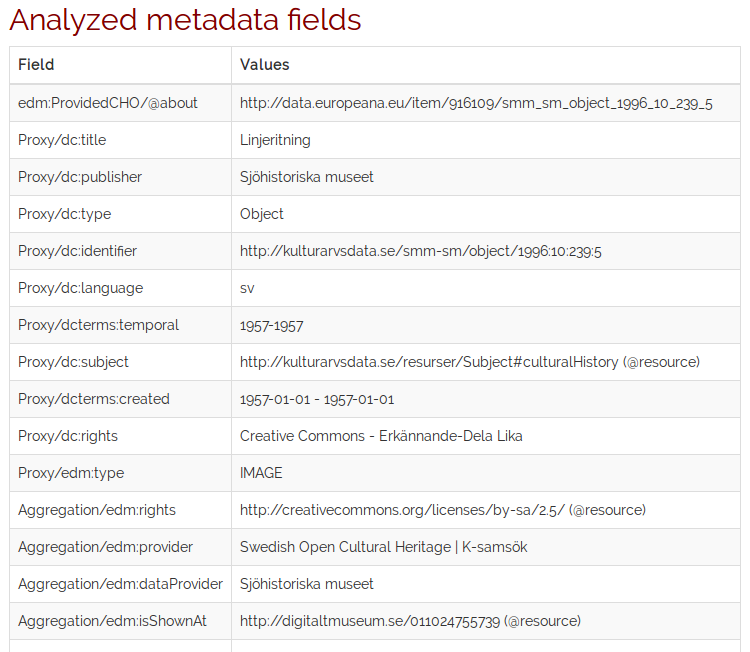
Record view

You can access thhe UI in the usual web interface:

http://144.76.218.178/europeana-qa/

Select one of the last six dimension to get the results.

Events, presentation, article

The big news is that the Europeana Data Quality Committee as a Europeana Network and EuropeanaTech Working Group is formed in March. It is a great honor, that I was involved. We have a quite active message board, a bi-weekly teleconference and a bi-yearly face-to-face meeting.
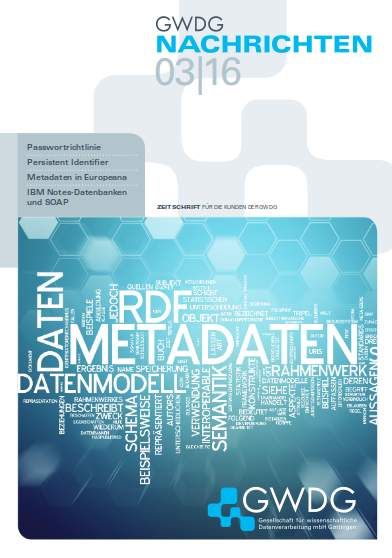
GWDG Nachrichten

I wrote an article for GWDG Nachrichten about the metadata quality issues in Europeana covering the roles of the Data Quality Committee, and Mr Yahyapour, the director of GWDG wrote a recommendation in the editorial column. The GWDG Nachrichten is circulated in the Göttingen Campus and in Max Planck Institutes.
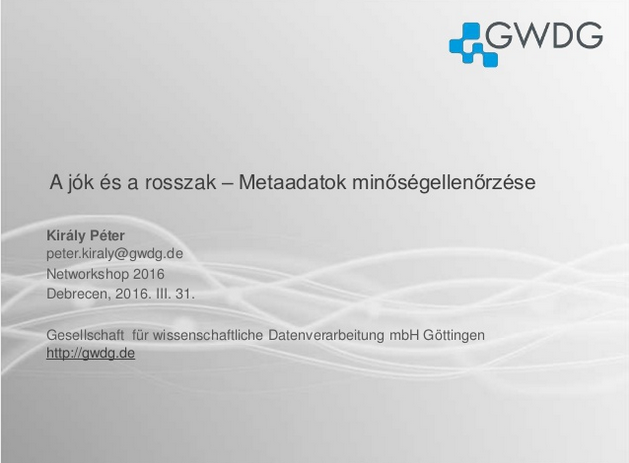
networkshop

I presented the research in Networkshop 2016 conference at the end of March in my home town. It was exceptional for me that I talked at the Auditorium Maximum of the University of Debrecen where I saw soo many unforgottable concerts, movies and speachhes as a teenager. Unfortunatelly I was the very last speaker on that day, and there were no time left for discussions. Here you can see the slides (note: they are in Hungarian).

Related Articles

sstable
cassandra
spark

Spark and Cassandra’s SSTable loader

Arunkumar

11/1/2024

cassandra
spark

Checkout Planet Cassandra

Claim Your Free Planet Cassandra Contributor T-shirt!

Make your contribution and score a FREE Planet Cassandra Contributor T-Shirt! 
We value our incredible Cassandra community, and we want to express our gratitude by sending an exclusive Planet Cassandra Contributor T-Shirt you can wear with pride.

Join Our Newsletter!

Sign up below to receive email updates and see what's going on with our company

Explore Related Topics

AllKafkaSparkScyllaSStableKubernetesApiGithubGraphQl

Explore Further

cassandra